Excess deaths go negative
This is a hugely significant graph but we need to think very carefully before jumping to conclusions about what it means.
In the first wave of the COVID-19 pandemic the number of excess deaths compared with five year averages for the relevant time of year significantly exceeded identified COVID deaths in Britain and nearly all other countries where it was possible to make a comparison,
This was probably partly due to an underestimate of the impact of COVID and partly due to indirect effects, for example people not going to hospital for fear of getting COVID and dying of conditions for which they would otherwise have gone and been successfully treated.
In the second wave this went into reverse in Britain and many other countries which publish reasonably accurate and honest statistics (not necessarily in those where "official" stats are an arm of state propaganda, see here for an example.)
This is harder to explain and may not represent the true long term picture but one part of the explanation is that measures taken against COVID-19 have not just reduced the number of people we lost to the Coronavirus itself but also saved lives which would otherwise have been lost to other diseases. For example, flu deaths have almost been wiped out this year. COVID may have killed some people who would otherwise have died of flu, measures taken against COVID almost certainly also saved the lives of some people who without those measures have died of flu.
It's important to appreciate that the data we have today do not give the whole picture of the impact that events which have already happened will ultimately cause. Even if we can get deaths from COVID down to minimal levels this summer and keep them there, we will be picking up the pieces from the pandemic for the better part of a decade in health terms - five years from now the indirect effects of the pandemic such as later diagnosis of cancer, heart disease and other conditions will still be causing deaths
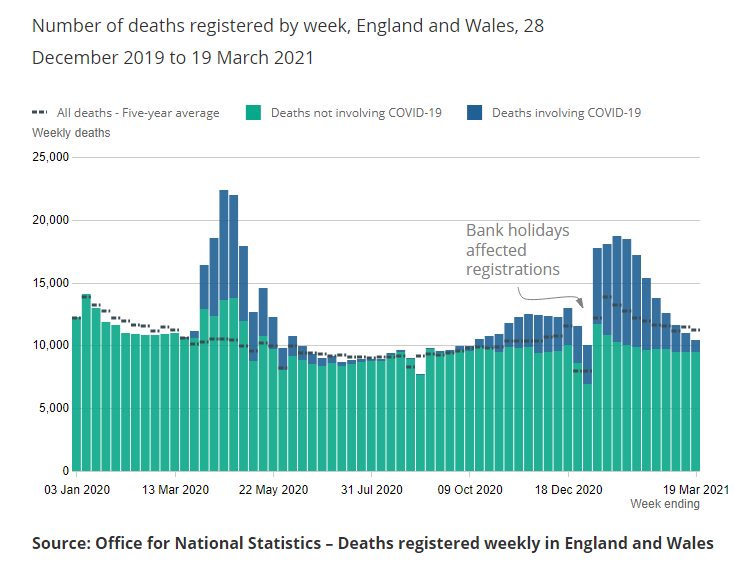
The ONS chart above shows total deaths, COVID deaths, and five year averages over the course of the pandemic to date and illustrates how excess deaths exceeded identified Coronavirus deaths in the first wave but were less than identified Coronavirus deaths in the second wave.
What is really interesting - and I will admit, surprising - is that in the last two weeks excess deaths appear to have gone negative.
I don't have an explanation for this and I think we need to be very careful not to leap to conclusions. I'm sure people will use this data to support all manner of previously held political theories and I'm equally sure that most of those people will be using it as the proverbial drunken man uses a lamp-post - for support rather than illumination.
There are still people dying around the world from COVID and as the saying goes, until we're all safe nobody is safe.

Comments